Debugging kAFL, A Snapshot-based Fuzzer

kAFL
Right of the bat, these sources act as the single sources of truth if you want to get a deeper understanding of kAFL: kAFL White Paper kAFL Doc
What’s the blogpost about?
Recently, I wanted to dive into the world of fuzzing, espcially kernel fuzzing, which is what led me to this project. I knew nothing about Fuzzing, what’s a fuzzer, harness, corpus, frontend, backend, mutator, snapshot-based fuzzing. None of these made sense to me, so kAFL is the perfect project for me to dive in and learn about all those concepts.
I wanted to utilize kAFL to fuzz Windows kernel drivers/core system component, but while the Github repo provided a great example for both fuzzing against the kernel mode target and the user mode target, I still find myself stuck in a suitiation where the fuzzer does not work the way I inteded. Well, the most important question is, how do we figure it out? The only answer is to start debugging..
kAFL Infrastructure
The white paper ^ has nice explanation for kAFL’s internal infrastructure, you can also find it on their github
Debugging the kAFL Python Frontend
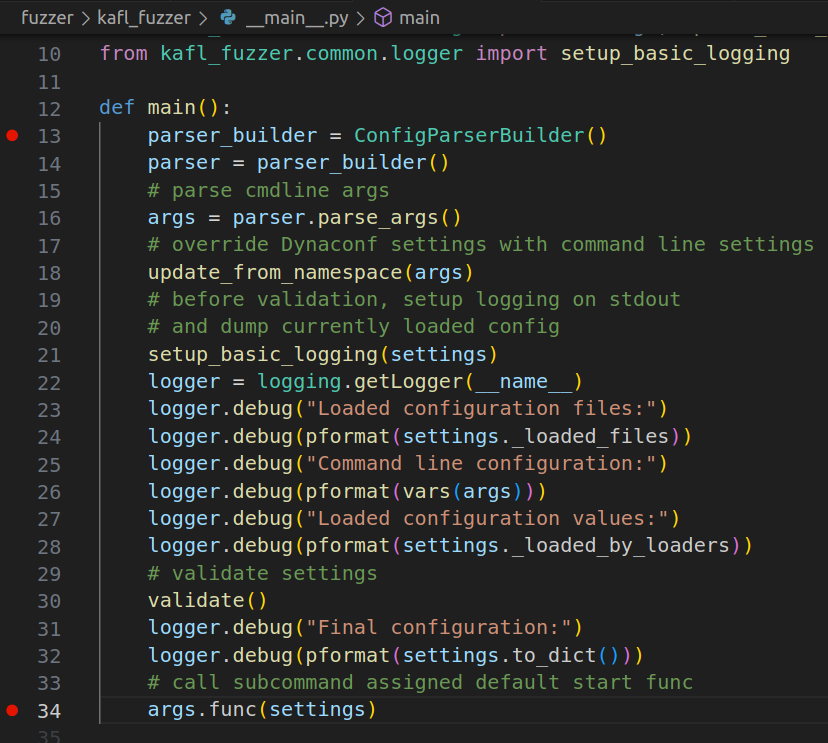
The frontend fuzzer kAFL itself is written in Python, and the vscode is prob the best option here to debug anything in Python. So I find the __main__.py and put a couple breakpoints
 Upon creating the Python debug configuration file and launching it with
 kafl fuzz, it hits those breakpoints but I was unable to continue debugging because the function qemu._connect() will fail due to a socket error. It turns out the frontend python script is communicating to the QEMU instance via UNIX Socket as documented in the kAFL documentation, and the socket was not yet established by QEMU-Nyx. So what can we do? The answer is easy, just start the QEMU instance ourselves.
1
├── interface_N                  - socket between kAFL worker N and Qemu N
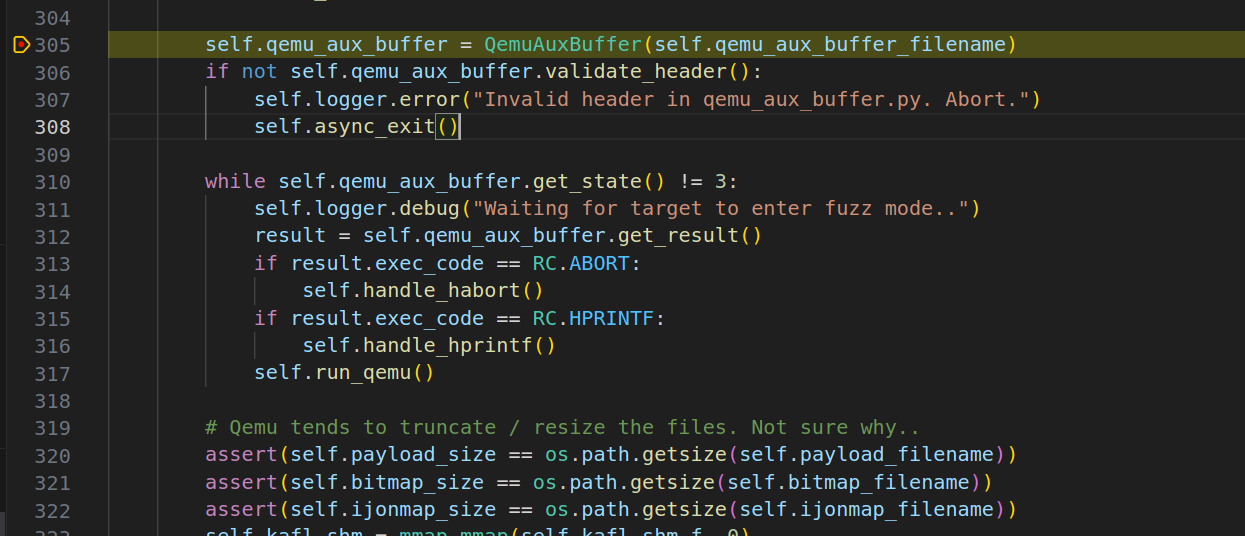
Patch kAFL Python Frontend
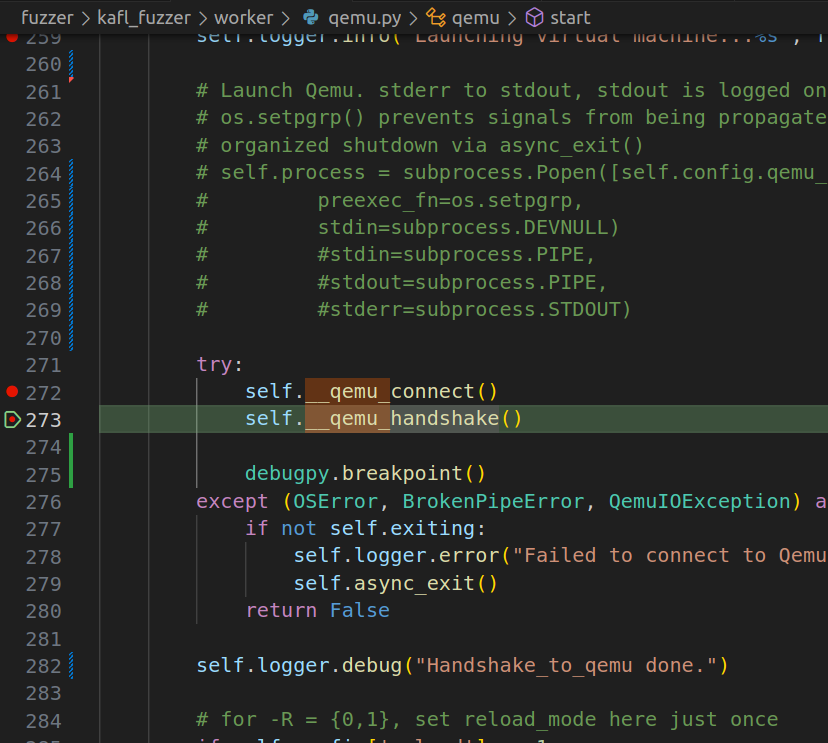
The kAFL fuzzer will prepare all the QEMU auguments internally and kick off the QEMU process for us. As you see in the screenshot above, I have commented out the subprocess which now the kADL will not do this. The reason is that While QEMU provides useful stub -S, -s for pausing the VM image at it’s first vCPU execution, we would still love to pause the QEMU process at the initialization phase (i.e., Machine/CPU/Peripheral initialization) which is the actual main() function in vl.c file (QEMU 4.2.0 release).
So, we can tell the python script to pause at qemu.connect() and then start the QEMU-Nyx instance ourself -> wait for the QEMU-Nyx socket to listen for connection -> continue the frontend fuzzer -> we can now continue the debugging process
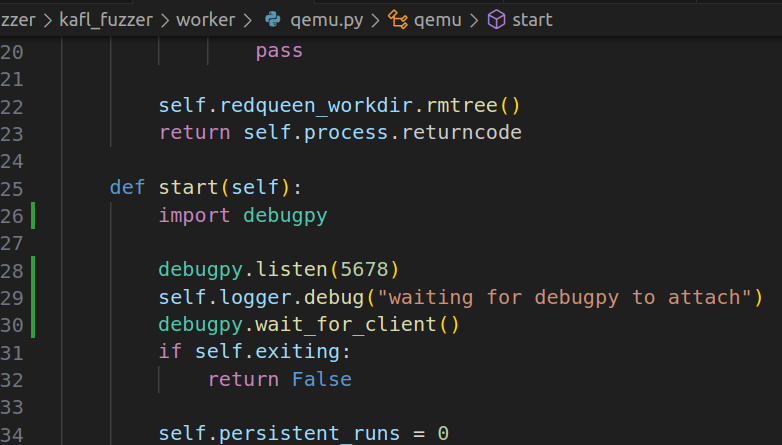
To achieve this, I leveraged debugpy which is what vscode uses under the hood for python debugging
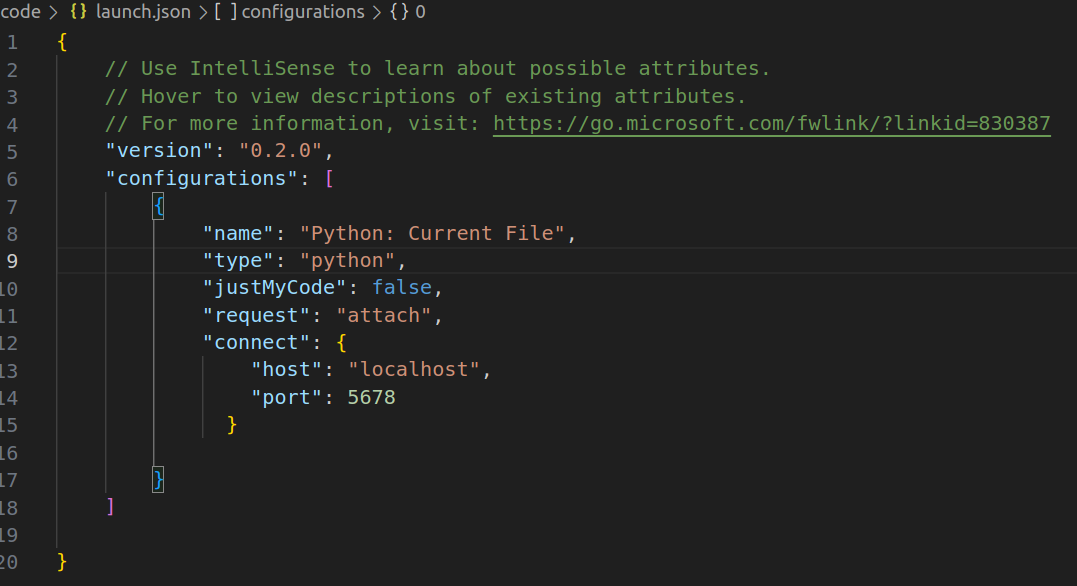
And the configuration file
Building QEMU-Nyx yourself
If you look at the repo QEMU-Nyx, you will see it included a .sh script to build the QEMU-Nyx with a few options
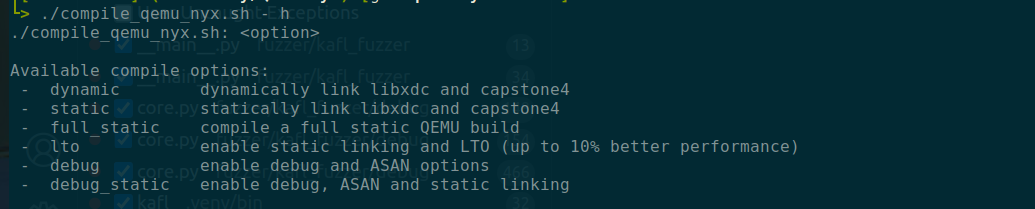 Here is the actual flags being passed to configure
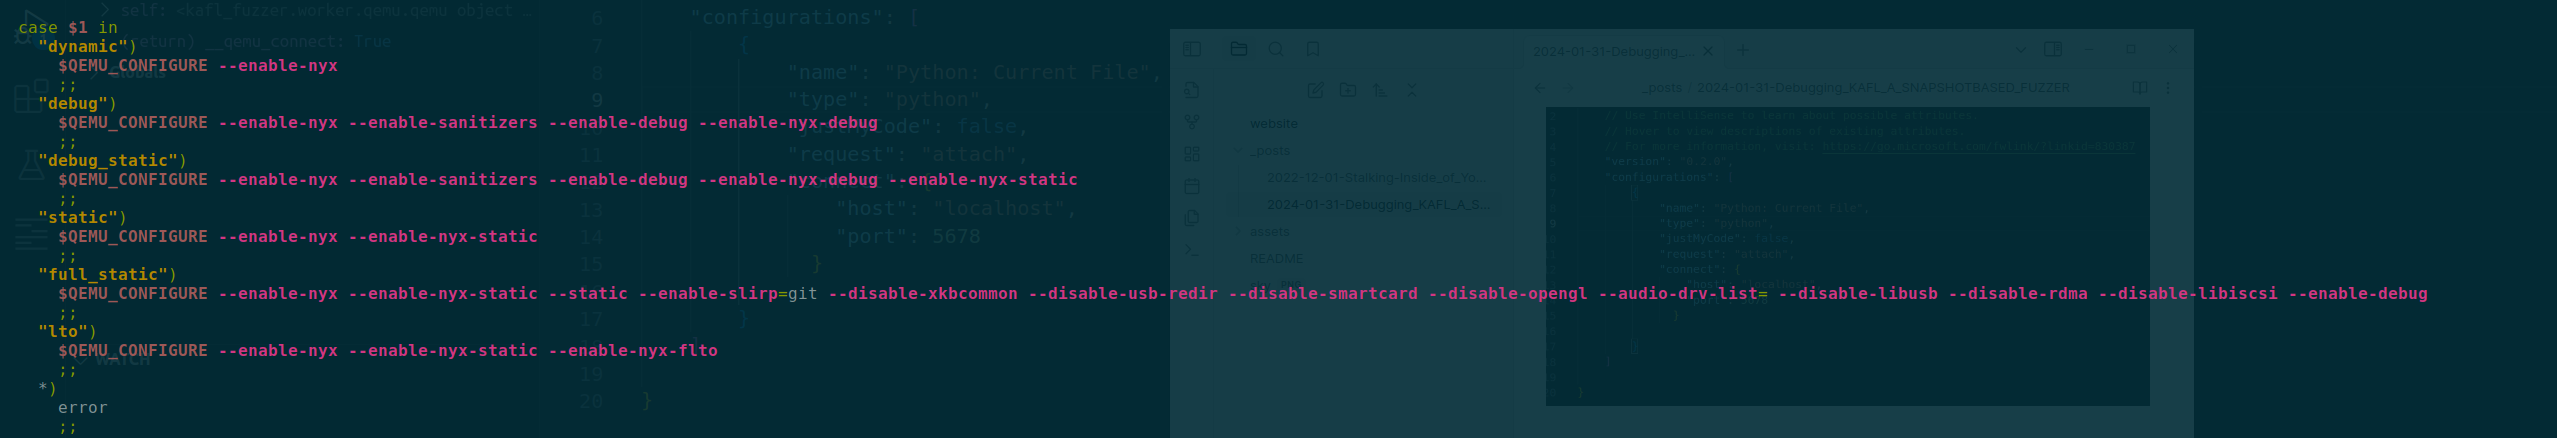
This is done so that we can get the full symbol for the qemu-system-x86_64 and start debugging with gdb.
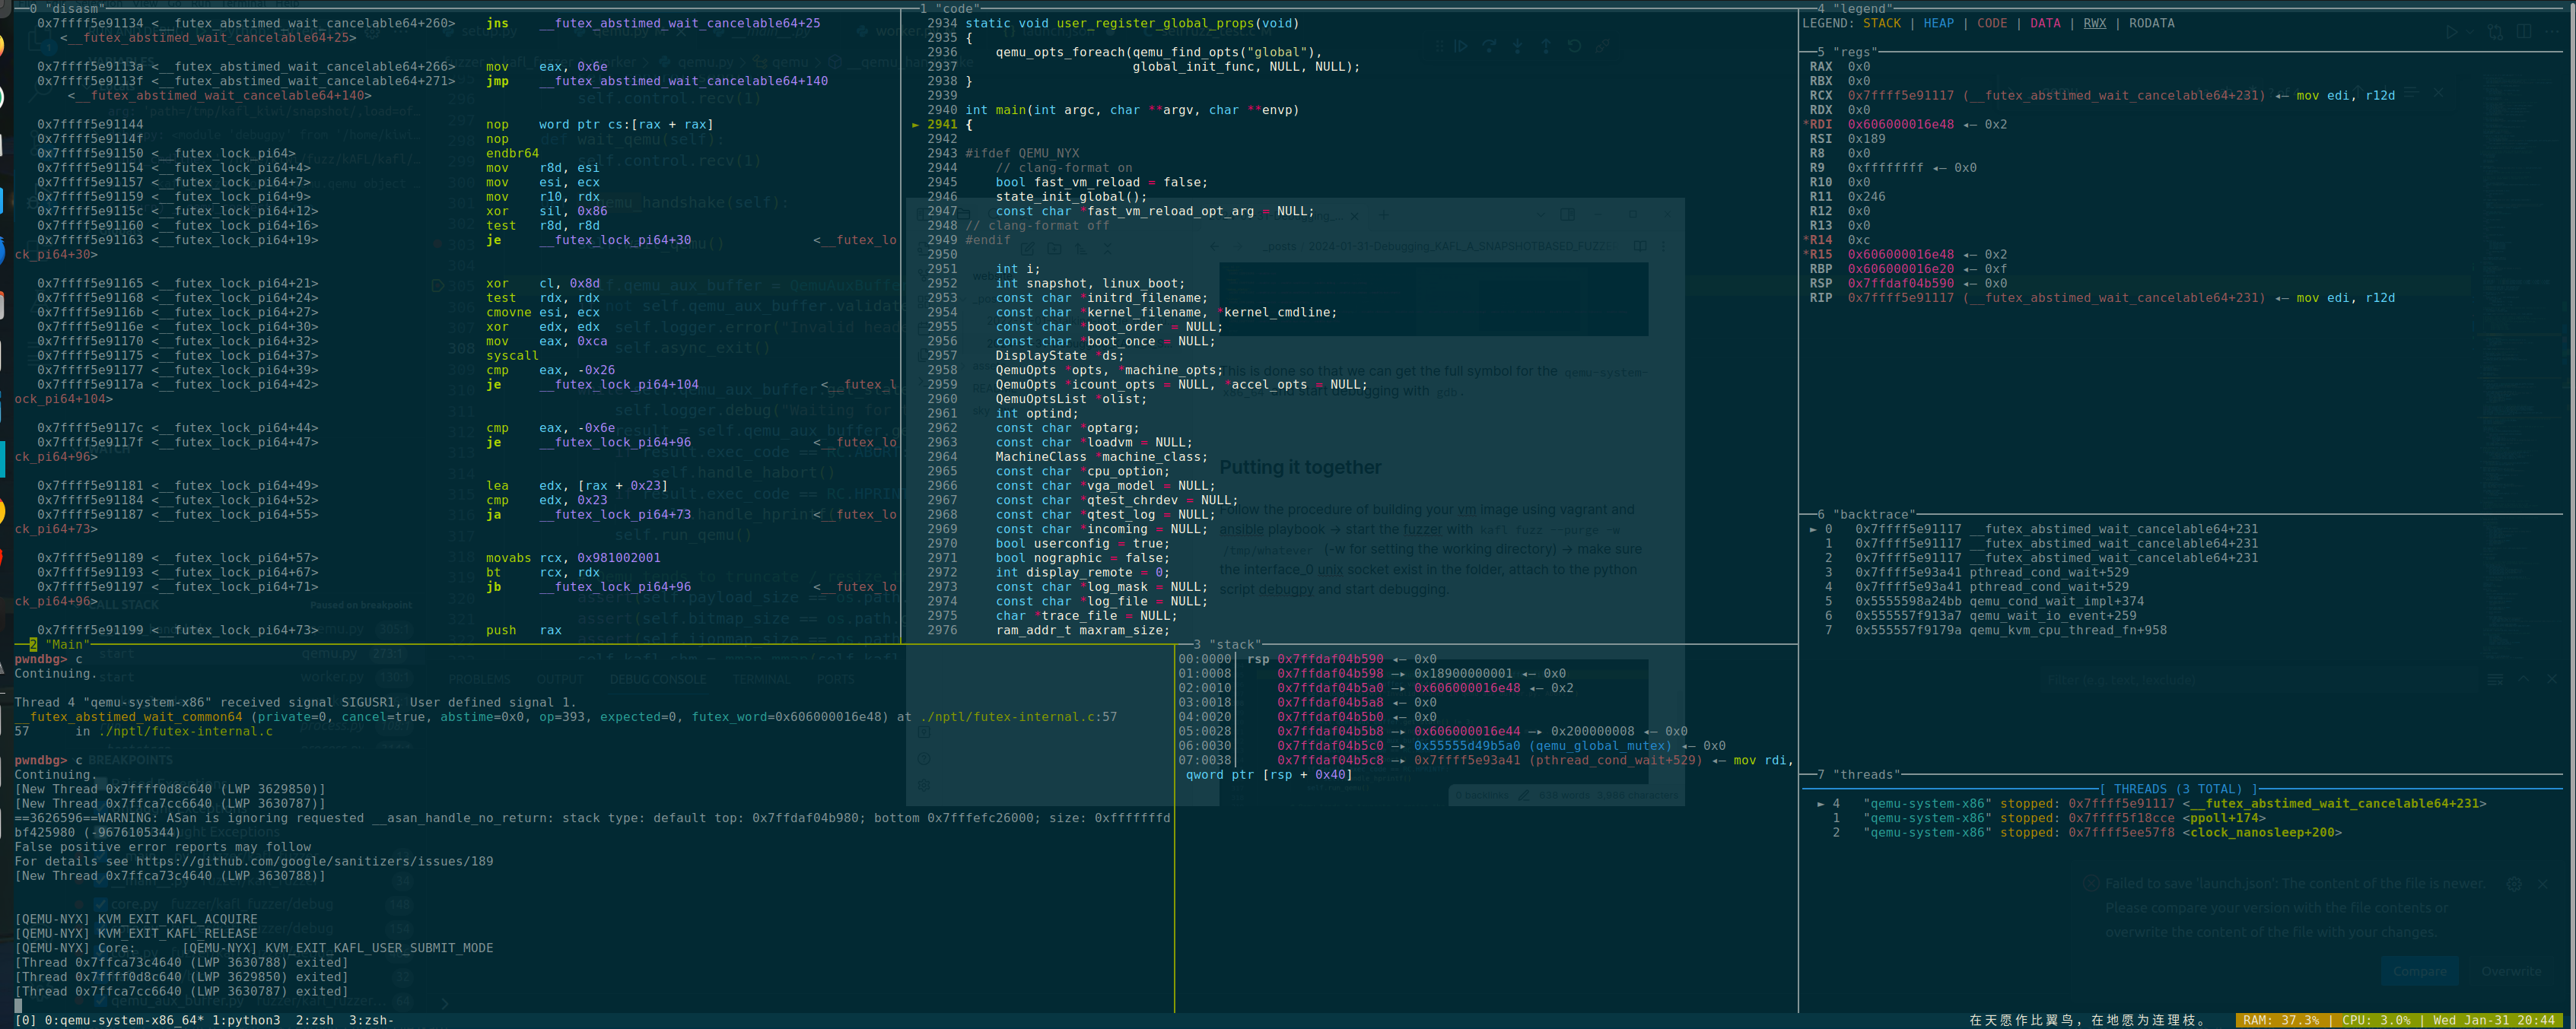
Putting it together
Follow the procedure of building your vm image using vagrant and ansible playbook -> start the fuzzer with kafl fuzz --purge -w /tmp/whatever (-w for setting the working directory) -> make sure the interface_0 unix socket exist in the folder, attach to the python script debugpy and start debugging.
Getting Full System Dump While Fuzzing
The kAFL patches the monitor/GUI interface when it starts, so we can’t really utilize the qemu monitor command line to snatch a full system memory dump while the fuzzer is running.
Pausing Fuzzer And Collecting Memory Dump
You can technically “pause” the fuzzer and get your system dump there.
To make sure the Windows guest vm is able to collect a full system memory dump in QEMU, we need to make sure that it installs the FwCfg driver which is included in the virt-io ISO installer, for more detailed instruction, I found this blog very helpful Guest Windows debugging and crashdumping under QEMU/KVM: dump-guest-memory, vmcoreinfo and virtio-win
Well the trick to “pause” the fuzzer is simply reapplying what I talked about in the Putting It Together with another trick - using socat. The details is documented QEMU monitor with socat.
Here is how you do it:
- We are still gonna run the same command line argument with our GDB/Pwndbg, but this time adding
-device vmcoreinfo --monitor unix:qemu-monitor-socket,server,nowaitat the end
1
gdb --args "./x86_64-softmmu/qemu-system-x86_64" -enable-kvm -machine kAFL64-v1 -cpu kAFL64-Hypervisor-v1,+vmx -no-reboot -net none -display none -chardev socket,server,id=nyx_socket,path=/tmp/kafl_kiwi/interface_0 -device nyx,chardev=nyx_socket,workdir=/tmp/kafl_kiwi,worker_id=0,bitmap_size=65536,input_buffer_size=131072 -device isa-serial,chardev=kafl_serial -chardev file,id=kafl_serial,mux=on,path=/tmp/kafl_kiwi/serial_00.log -m 4096 -drive file=/home/kiwi/.local/share/libvirt/images/windows_x86_64_vagrant-kafl-windows.img -fast_vm_reload path=/tmp/kafl_kiwi/snapshot/,load=off -device vmcoreinfo --monitor unix:qemu-monitor-socket,server,nowait
- Kick off kAFL fuzzer frontend (patching out the subprocess.run that kick off another QEMU instance because we are doing it with gdb already)
- After the fuzzing loop starts, hit
Crtl + Cin gdb - Go into the gdb directly, and connect to the QEMU monitor using
socat -,echo=0,icanon=0 unix-connect:qemu-monitor-socket - Run
dump-guest-memory -w memory.dmpin the monitor CLI - Continue the execution in gdb
After that you should be able to collect a full system dump

Debugging the Windows Dump?
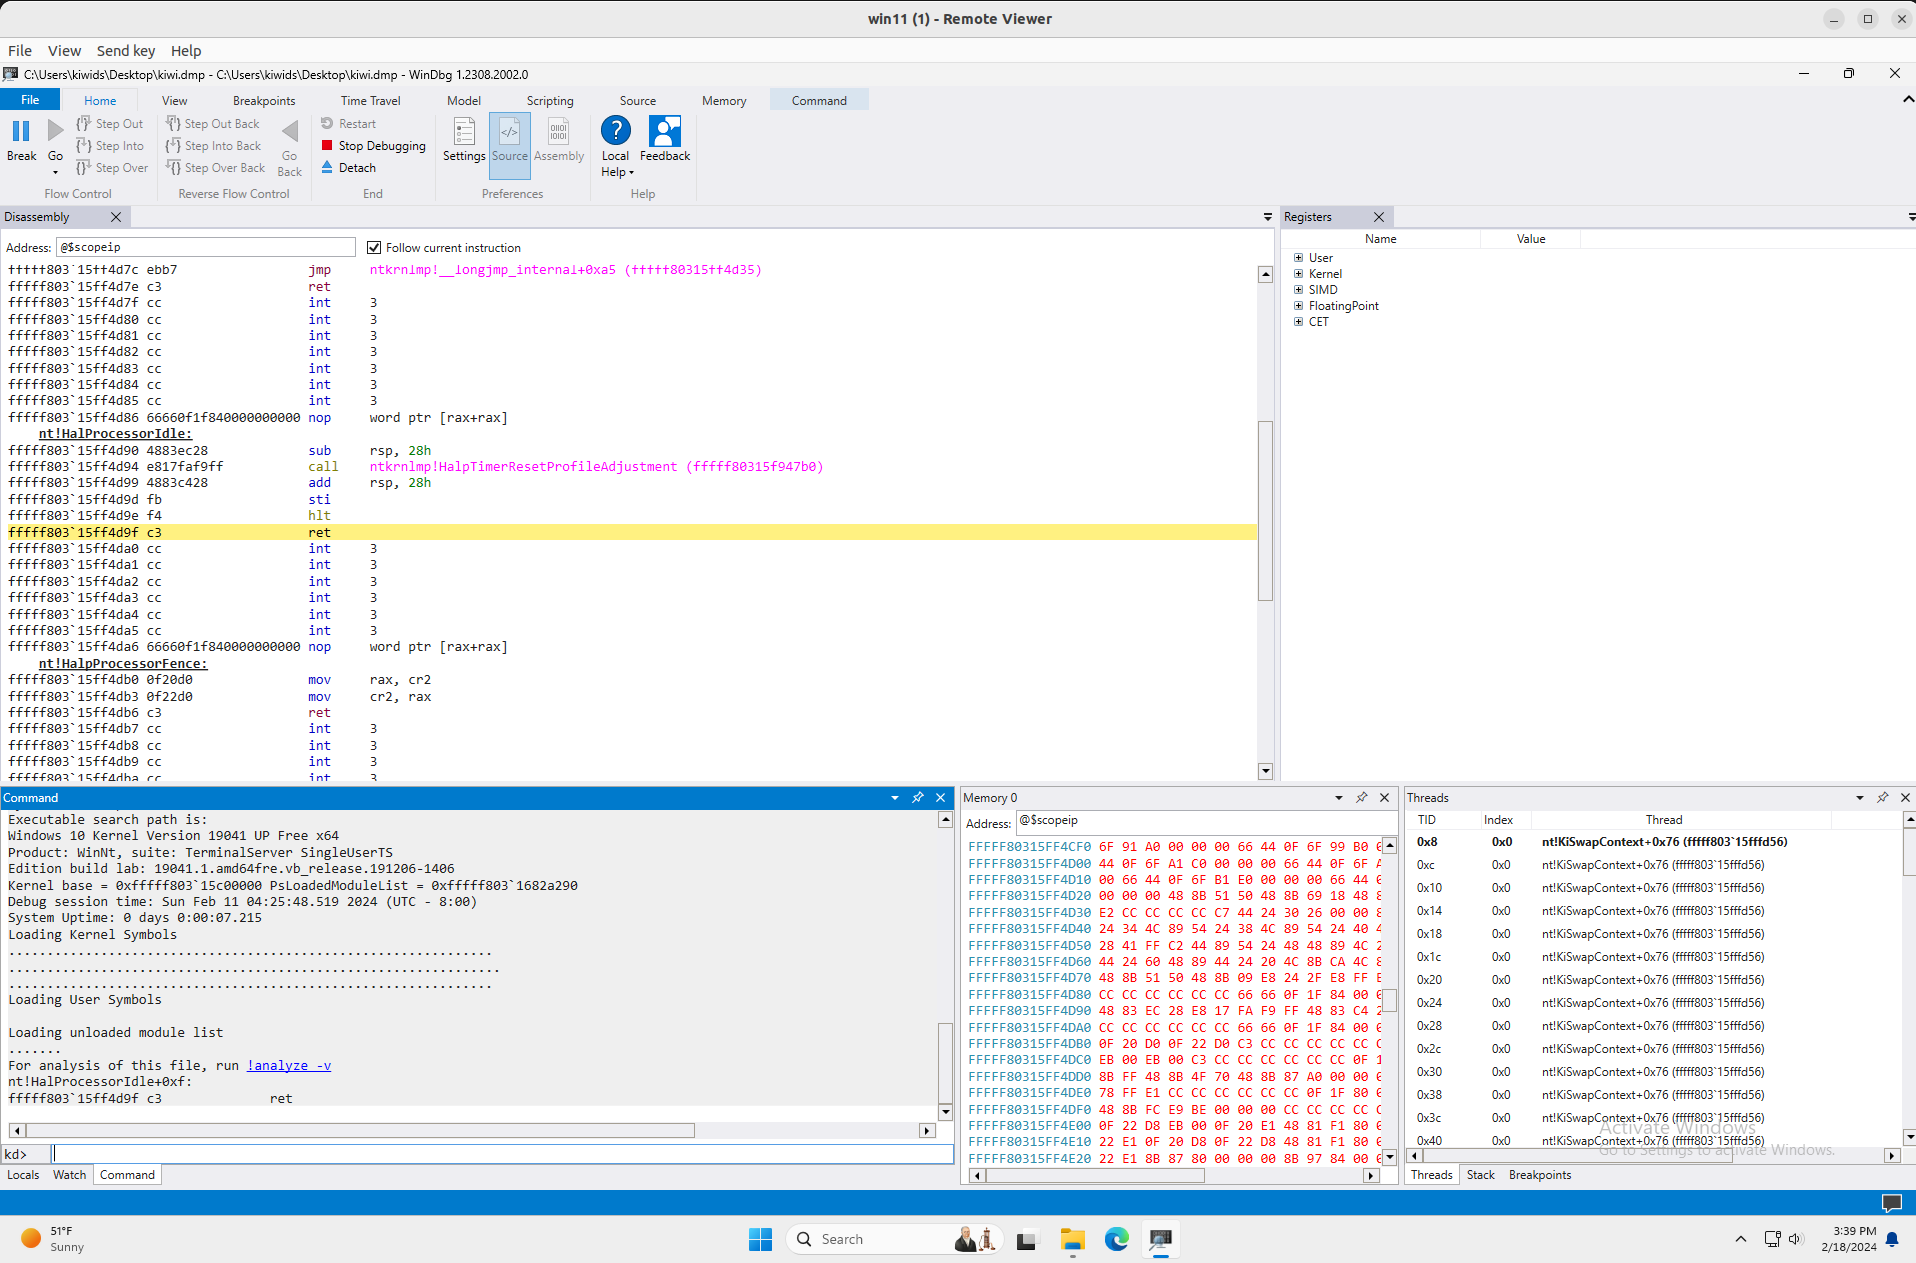
This is not your typical dump you collected from a kernel panic crash or from WinDbg. This is the dump we collected via some additional loops in QEMU monitor. Since the dump we had is in WinDbg-compatible format, we can leverage WinDbg again to troubleshoot where the “Hang” comes from…
Dump Analysis Using WinDbg
Well, telling WinDbg to analyze our dump is quite easy, just simply drag and drop the .dmp file into WinDbg and run !analyze -v.
After the WinDbg finished analyzing, we can find our harness by locating the process Ex.
!process 0 0 lsass.exe.
We may also list information regarding all threads running under our harness process with !process 0 7 lsass.exe
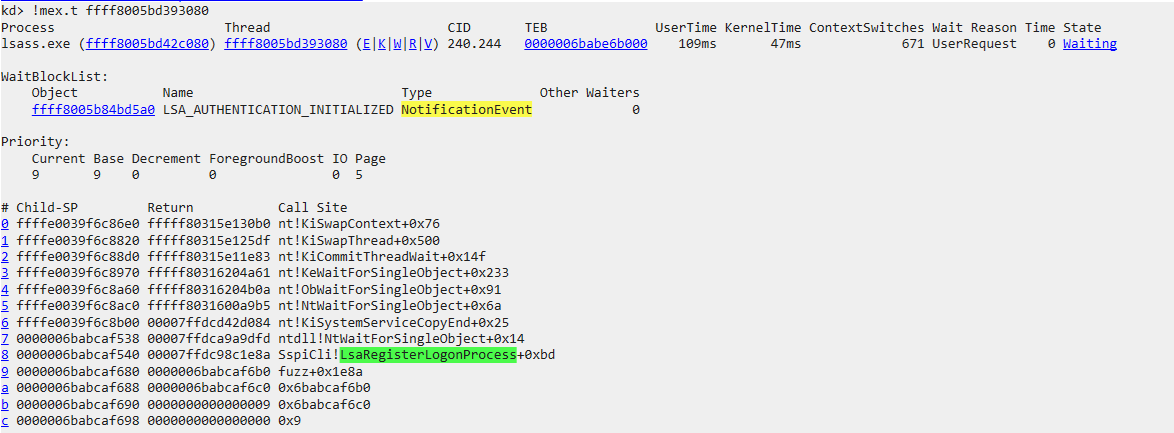
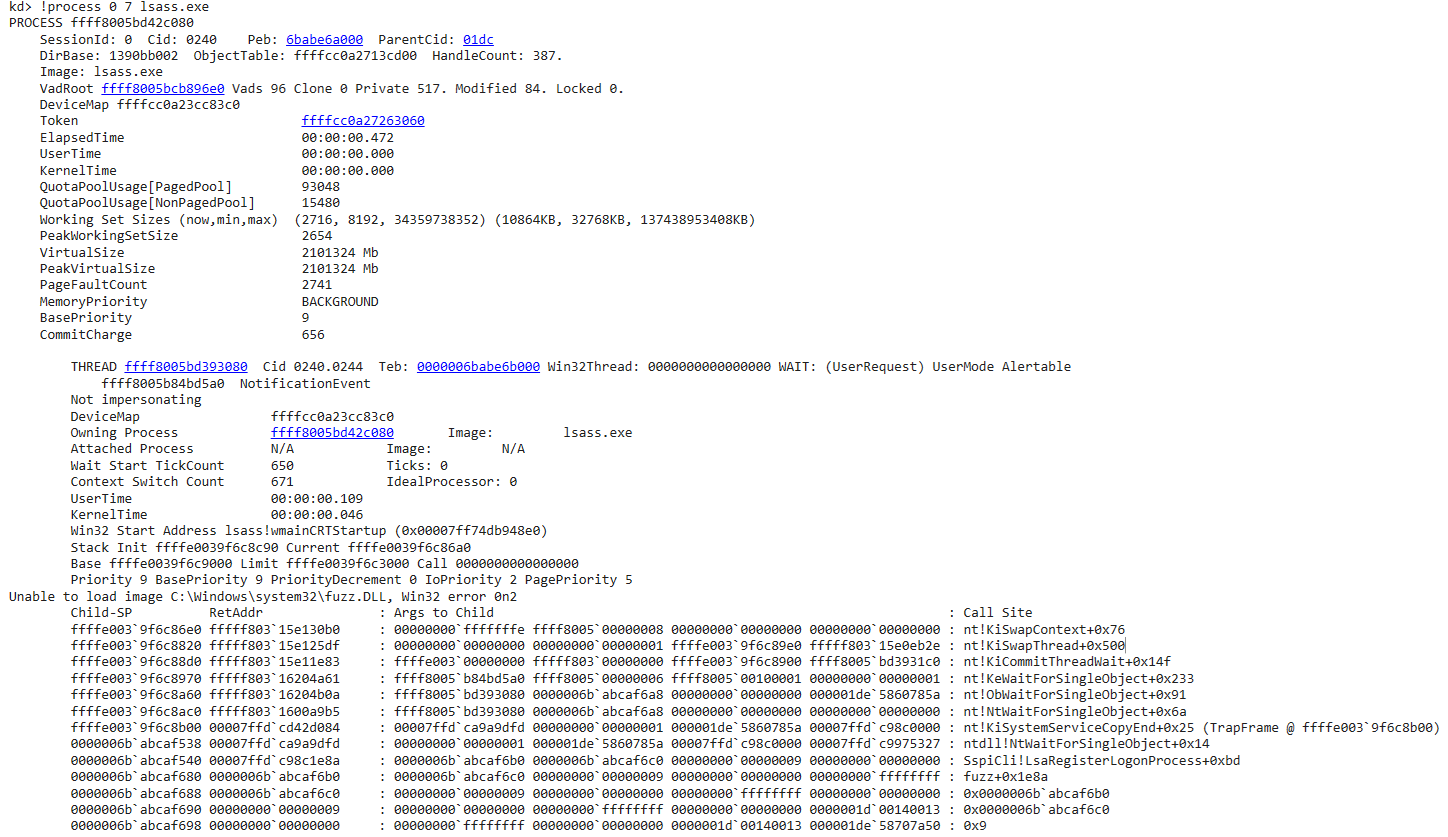 Right off the bat, we find our thread that’s running our harness, however, it is at a wait stage as the WinDbg says:
 A couple of things worth noting:
- This is a Alertable event that the thread is waiting for.
- The
NoficationEvent- Describe the type of Events. (more onEventobjects can be found here and here)
Please Wait()
We know the thread is waiting for the Event to be “Signaled” so our thread can continue executing our harness. But what function lead to the NtWaitForSingleObjet(). The answer can be found yet again in the screenshot - Sspi!LsaRegisterLogonProcess(). LsaRegisterLogonProcess is a interesting function and Microsoft documented as
The LsaRegisterLogonProcess function establishes a connection to the LSA server and verifies that the caller is a logon application.
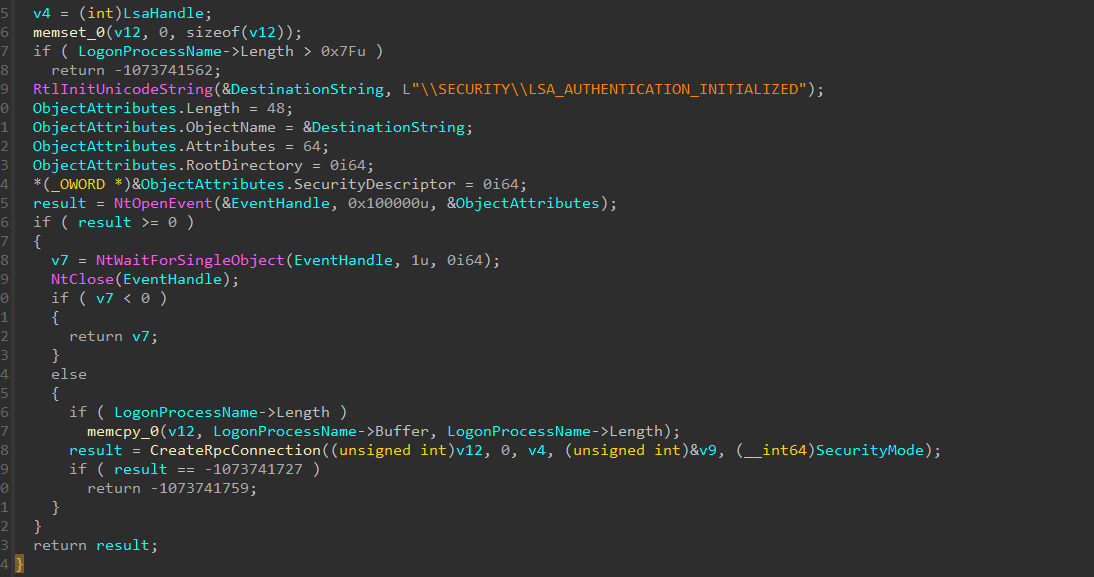
If we open the function in IDA, we will find where the call is made!
Finding the Event in WinDbg
If you want to know how to find this “named” Event object in WinDbg dump, check out my other note.
We will be utilizing some old MS WinDbg extension called Mex, Thanks for the people who made this extension and also @DebugPrivilege who documented the usefulness of it.
Once you downloaded Mex and extracted to disk, run .load PATH_TO_MEX.dll in your WinDbg console.
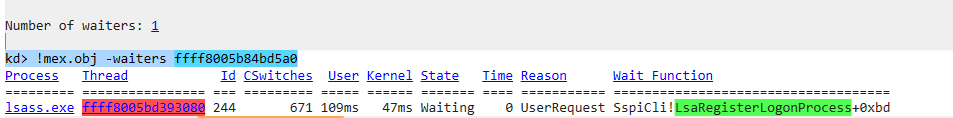
After that, we can utilize its !p to dump the process information given our lsass.exe address. Next, we can list all threads information by just clicking on the !mex.listthreads
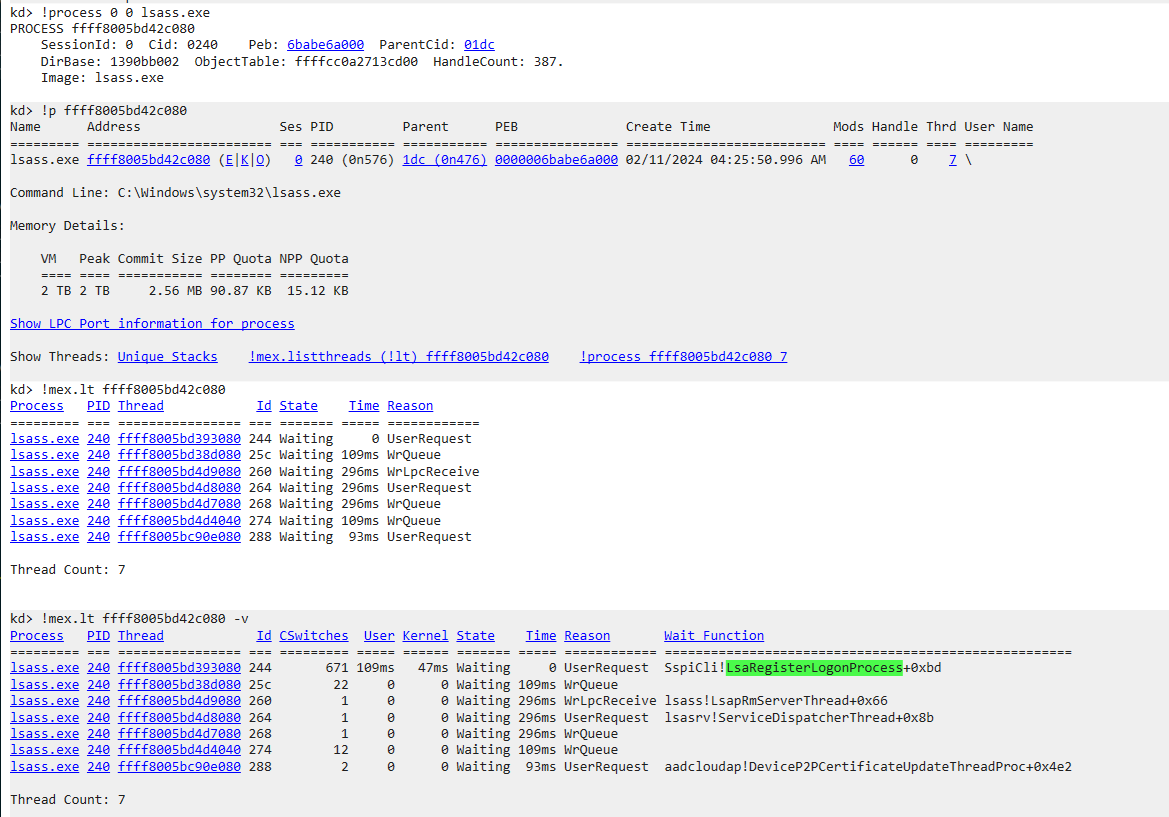 We found the same thread that was running our harness, and now let’s list more detail about the thread. Look, there’s our
 Event we just saw previously in IDA, and the name also matches.
 Now we can further inspect the
 Object by following the link of the address pointing to our NotificationEvent. The WaitBlockList is a field of nt!_THREAD struct which specifies a list of synchronization object that the thread is waiting on, find more info here.
kAFL Timeout
Perhaps it was too early for the Event to be set for listening or the thread that’s supposed to signal the Event hasn’t done so (because of the “hacky” way I injected my harness), our harness thread was “hanging” at this point. Since kAFL is a snapshot-based fuzzer, it utilize QEMU-Nyx to achieve rapid VM reload at the point where the system snapshot was taken and when the execution ends. kAFL also specifies soft/hard timeouts for execution, if harness thread is blocked/put into a wait state, and if the thread was blocked for the duration that’s longer than the timeout, then the VM will be reset by the fuzzer. In this case, our Event was not signaled which caused our harness thread “hangs” virtually forever and kAFL resetted the VM, the infinite loop keeps on going…
Closing
It was very interesting diving into the fuzzer and troubleshoot our harness problem. This whole journey sparked my interested in Fuzzing, Hypervisor studies and I am excited for the future blog posts!
Happy lunar new year and see you on the other side!